Contents
Frost 1980: selective grazing on phytoplankton
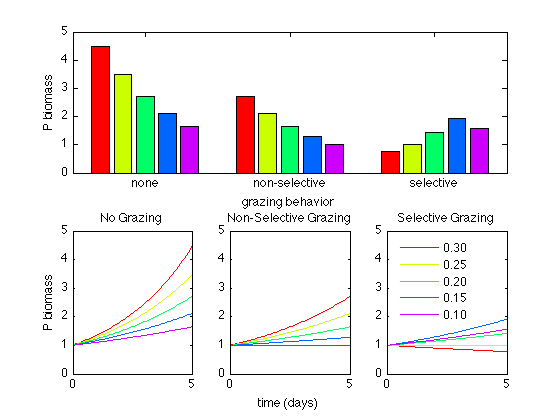
This model recreates the work by Frost in 1980 to explore how selective grazing may structure phytoplankton communities. In this model there is no interaction between grazers or phytoplankton species. The naming conventions are as follows:
Pic = Phytoplankton: control case
Pins, gins = Phytoplankton, grazing values: non-selective grazing
Pis, gis = Phytoplankton, grazing values: selective grazing
clear
close all

% set up initial variables
P0=ones(1,5);                       % Initial phytplankton concentration
mu=[0.30 0.25 0.20 0.15 0.10];      % Phytoplankton growth rate
gis=[0.35 0.25 0.13 0.02 0.01];     % Grazing rate, selective
gins=0.1.*ones(1,5);                % Grazing rate, non-selective

% duration in days,
duration=5;

% timestep in hours, then days
timestep=2;
timestep=24/timestep;

% total number of steps: add 1 to start at t0
ts=duration*timestep+1;

% set up response matrices
Pic=nan(ts,5);Pic(1,:)=P0;          % control - no grazing
Pins=nan(ts,5);Pins(1,:)=P0;        % non-selective grazing
Pis=nan(ts,5);Pis(1,:)=P0;          % selective grazing
Main loop
for i=2:ts
    Pic(i,:)=Pic(i-1,:).*exp((mu)./timestep);
    Pins(i,:)=Pins(i-1,:).*exp((mu-gins)./timestep);
    Pis(i,:)=Pis(i-1,:).*exp((mu-gis)./timestep);
end
Plot results
The two lines below are equivalent and they set up the time vector for plotting the responses.
t=linspace(0,duration,ts);
% t=0:1/timestep:duration;

cmap=colormap(hsv(5));

subplot(2,1,1)
bar([Pic(end,:);Pins(end,:);Pis(end,:)],'grouped')
set(gca,'xticklabel',{'none','non-selective','selective'});
xlabel('grazing behavior')
ylabel('P biomass')
ch=get(gca,'children');
ylim([0 5])

subplot(2,3,4)
set(gca,'nextplot','replacechildren','colororder',cmap)
plot(t,Pic)
title('No Grazing')
ylim([0 5])
ylabel('P biomass')
box on

subplot(2,3,5)
set(gca,'nextplot','replacechildren','colororder',cmap)
plot(t,Pins)
title('Non-Selective Grazing')
ylim([0 5])
xlabel('time (days)')
box on

subplot(2,3,6)
set(gca,'nextplot','replacechildren','colororder',cmap)
plot(t,Pis)
title('Selective Grazing')
ylim([0 5])
for i=1:length(mu)
    lgd(i,:)=sprintf('%0.2f',mu(i));
end
lg=legend(lgd,'location','northwest');
set(lg,'box','off','color','none')
box on

% [Pic(end,:);Pins(end,:);Pis(end,:)]'