Contents
Model 2: Zooplankton class
Adapted from Frost zooplankton notes
Nutrient-limited phytoplankton growth with grazing parameters and initial conditions as Handout, part d: grazing=0.1/day=g
clear
close all
Initial Conditions
k=80;                   % 80 Duration of run, in days
t=zeros(k,1);t(1)=1;    % Initializing the time vector

P=zeros(k,1);           % Initializing the Phytoplankton vector
PHY=1000;               % 1000 Phytoplankton initial concentration- cells/L
P(1)=PHY;

PDN=zeros(k,1);         % Initializing the production vector
N=zeros(k,1);N(1)=10;   % 10 Initializing the dissolved Nitrogen vector
                        % Units here are in micromolar
NIT=N(1)*14;            % Converting micromolar to migrogram
                        % (multiply by atomic weight)

mumax=0.3465736;        % 0.3465736 Maximum phytoplankton growth rate
                        % Corresponds to 1 doubling per day
kn=14;                  % Half-saturation constant for nitrogen uptake
                        % by the phytoplankton cells
q=0.000157;             % 0.000157 Cell nigrogen content (cell quota) in
                        % micrograms nitrogen per cell
g=0.1;                  % 0.1 Grazing rate (per day)
Main Loop
for n=1:1:k
    t(n)=n;
    for m=1:1:24
        % This gives an hourly timestep for the calculations and the two
        % lines below recalculate the "per day" rates to "per hour"
        mu=mumax*(NIT/(kn+NIT))/24;
        graz=g/24;

        % Phytoplankton growth and production:
        kmg=mu-graz;
        prod=mu*PHY*(exp(kmg)-1.0)/kmg;
        PHY=PHY*exp(kmg);

        % Nitrogen uptake rates:
        uptake=q*prod;
        NIT=NIT-uptake;

        if NIT<0    % Dissolved nitrogen cannot have negative values
            NIT=0;
        end
    end

    % Here we track the results at the end of each 24 hour day
    P(n)=PHY;
    N(n)=NIT/14;
    PDN(n)=prod*24;
end
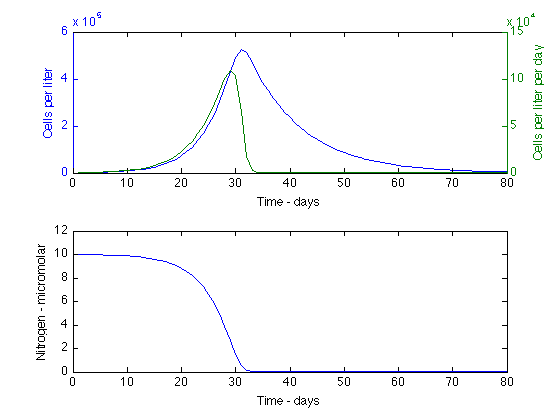
Plot the daily results
ax1=subplot(2,1,1);
[ax,hl1,hl2]=plotyy(t,P,t,PDN);
xlabel('Time - days');
set(get(ax(1),'Ylabel'),'String','Cells per liter');
set(get(ax(2),'Ylabel'),'String','Cells per liter per day');

subplot(2,1,2)
plot(t,N)
axis([0,k,0,12]);
xlabel('Time - days');
ylabel('Nitrogen - micromolar');