The Role of Grazing in Phytoplankton Ecology: Mortality
An introduction to some simple mathematical models of phytoplankton growth and grazing
(These notes adapted from Zooplankton Ecology class notes from B. W. Frost)
A PDF version of this page is available here.
a. Exponential Growth of Phytoplankton
Consider a phytoplankton species exposed to optimal light and excess nutrients in a laboratory batch culture. The cell concentration (Pt) of the population in the culture will increase exponentially with time (t):
Pt = P0eμt (1)
Suppose that µ, the specific growth rate, is constant and equal to 0.34657 day-1; this corresponds to a population doubling time of 2 days. If the culture initially contains 1000 cells liter-1 (P0) then, as Fig. 1 shows, the cell concentration in the culture will increase by 1000 times in only 20 days.
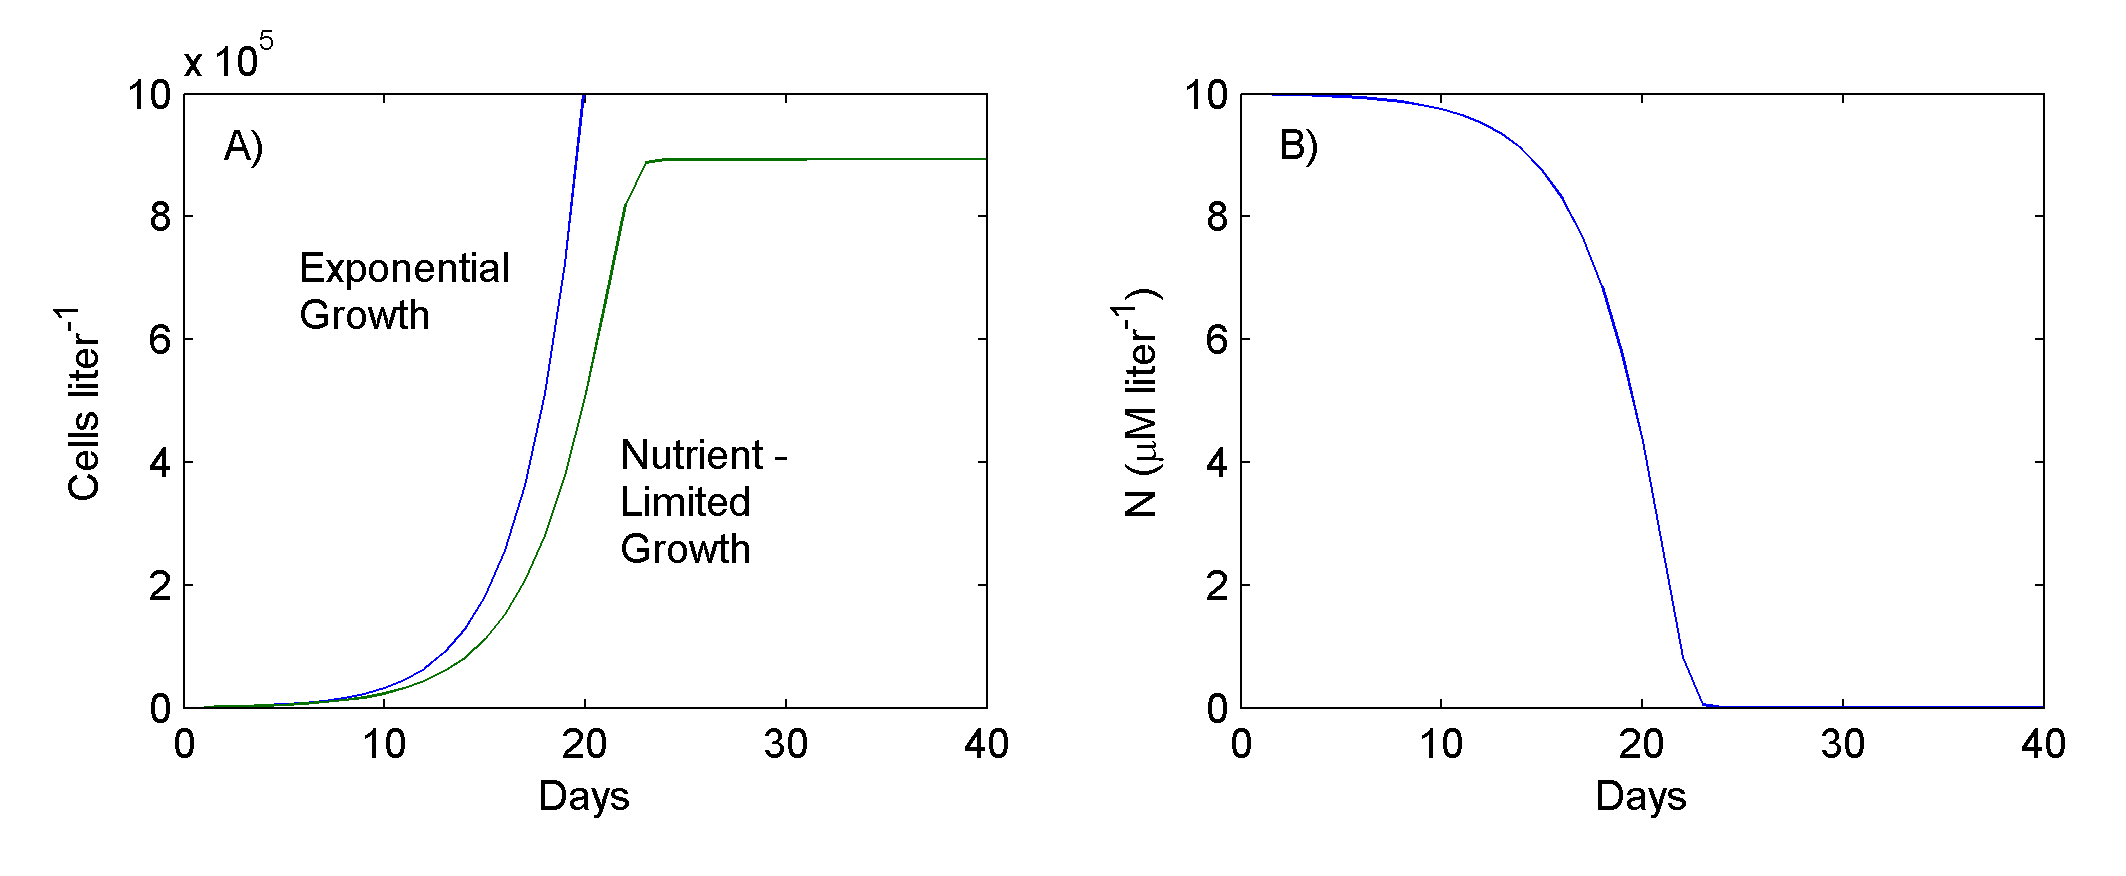
Figure 1. Phytoplankton exponential and nutrient-limited growth (A), and nitrogen concentration under nutrient limited growth (B).
b. Nutrient Limited Phytoplankton Growth
Eventually in a necessarily finite laboratory culture, such a phytoplankton population will exhaust the available supply of some essential nutrient. Assume that dissolved N, provided as nitrate ion, is the nutrient in shortest supply in the laboratory culture medium. Suppose that each phytoplankton cell contains 157 pgN (that is, 157 x 10-12 gN) and that the specific growth rate, µ, is no longer constant, but varies with nutrient concentration according to:
μ = μmaxN / kN + N (2)
If kN, the half-saturation constant for N uptake by the cells, is 1.0 µM N liter-1 (i.e., 14 µM N-1), and if the initial concentration of nitrogen in the culture medium is 10 µM N liter-1 (i.e., 140 µM N-1), then cell numbers in the culture will increase as shown in Fig 1. Initially the population increases exponentially, but eventually its growth begins to slow down as N decreases to very low concentrations, and finally the cell concentration levels off (growth rate = 0) when the supply of N is exhausted. With the phytoplankton's complete utilization of N from a liter of culture medium, 891,720 cells are produced (as expected from the cellular nitrogen content: 140 µM N liter-1 + 157 pgN cell-1); the cells accumulate in the culture.
As an example of how to model nutrient limited phytoplankton growth, see the Matlab model here.
c. Phytoplankton Standing Stock vs. Production Rate
So far, we have developed simple mathematical model was used to illustrate nutrient-limited growth of phytoplankton in a laboratory culture. The model described changes in population size with time as a limiting nutrient was depleted. It is also possible to describe changes in phytoplankton production rate with time as nutrient concentration changes. The model of nutrient-limited phytoplankton growth is
Pt = P0eμt
where μ = μmax [ N / (kN + N) ] (3)
As defined previously, µ is the actual (or realized), nutrient-dependent, daily specific growth rate of the phytoplankton. Knowing µ and phytoplankton standing stock (P), the phytoplankton production rate at any time t is calculated as
Production rate: specific growth rate x phytoplankton standing stock
µPt = μmax [ Nt / (kN + Nt) ] Pt (4)
{units: cells liter-1 day-1}
To convert production rate to units of mass, such as C or N, simply multiply the production
rate by the C-content or N-content per cell.
Fig. 2 shows the data for nutrient-limited growth (solution of eq. 3), plus the calculated daily phytoplankton production rate (eq. 4). Note that µ, which has a maximum value µmax = 0.34657 day-1 in our example (i.e., the population optimally can double in 2 days), will decline from µmax roughly similar to the curve for N, and will reach zero when N = 0 (Fig 3b).
Inference: Phytoplankton production rate depends not only on the phytoplankton specific growth rate and factors affecting it (e.g., nutrient supply in this case), but also on the phytoplankton standing stock (P). A very low standing stock of phytoplankton with high specific growth rate will give low production rates (e.g., at the start of a phytoplankton bloom). Conversely, a large standing stock of phytoplankton with very low specific growth rate will also give low production rates (e.g., nutrient-starved phytoplankton at the end of a bloom). Thus, production rate cannot be inferred from standing stock alone. One needs to know about µ (specific growth rate) as well.
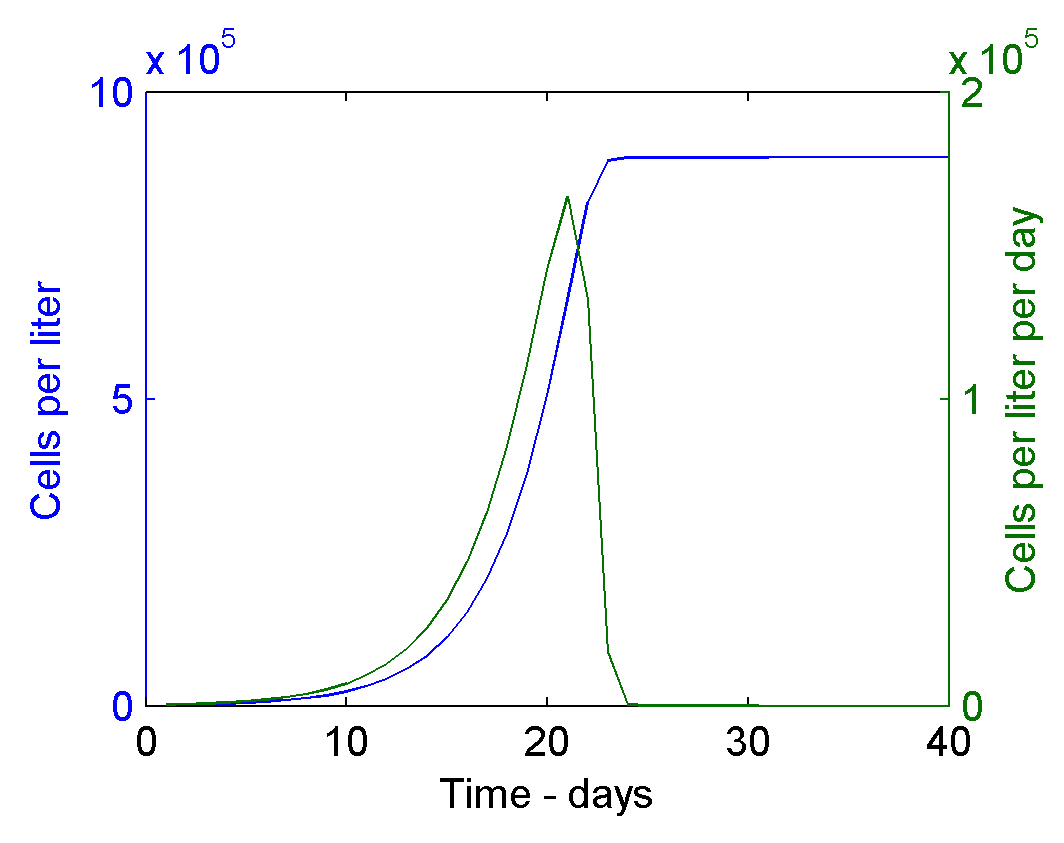
Figure 2. Phytoplankton abundance (blue line) and production rate (green line) under nutrient-limited growth.
d. Effect of Grazing on Phytoplankton Dynamics
The previous sections of this handout developed a simple model to describe nutrient-limited phytoplankton growth in a laboratory batch culture. Suppose that in addition to nutrient limitation there is simultaneous loss of phytoplankton cells due to grazing. Although, as we shall see, feeding rates of grazers depend on abundance of phytoplankton, for the simplest exploration of the effects of grazing we let the instantaneous specific grazing rate, g (with units [t-1]), be constant and describe phytoplankton growth by:
Pt = P0e(μ-g)t (5)
where μ = μmax [ N / (kN + N) ]
If µmax = 0.34657 day-1, kN = 1.0 µM N liter-1, and g = 0.1 day-1, then the phytoplankton population will grow as shown by Fig. 3. Compare Fig 3a with the nutrient-limited growth curve in Fig. 1, and notice that the maximum cell concentration is lower with grazing. Also notice that although a liter of culture medium with a given initial concentration of N necessarily produces the same number of cells as in the nutrient-limited case described earlier, the cells do not accumulate in the culture, but most (99%) eventually "disappear," that is, are eaten by grazers.
The model has simulated a phytoplankton bloom.
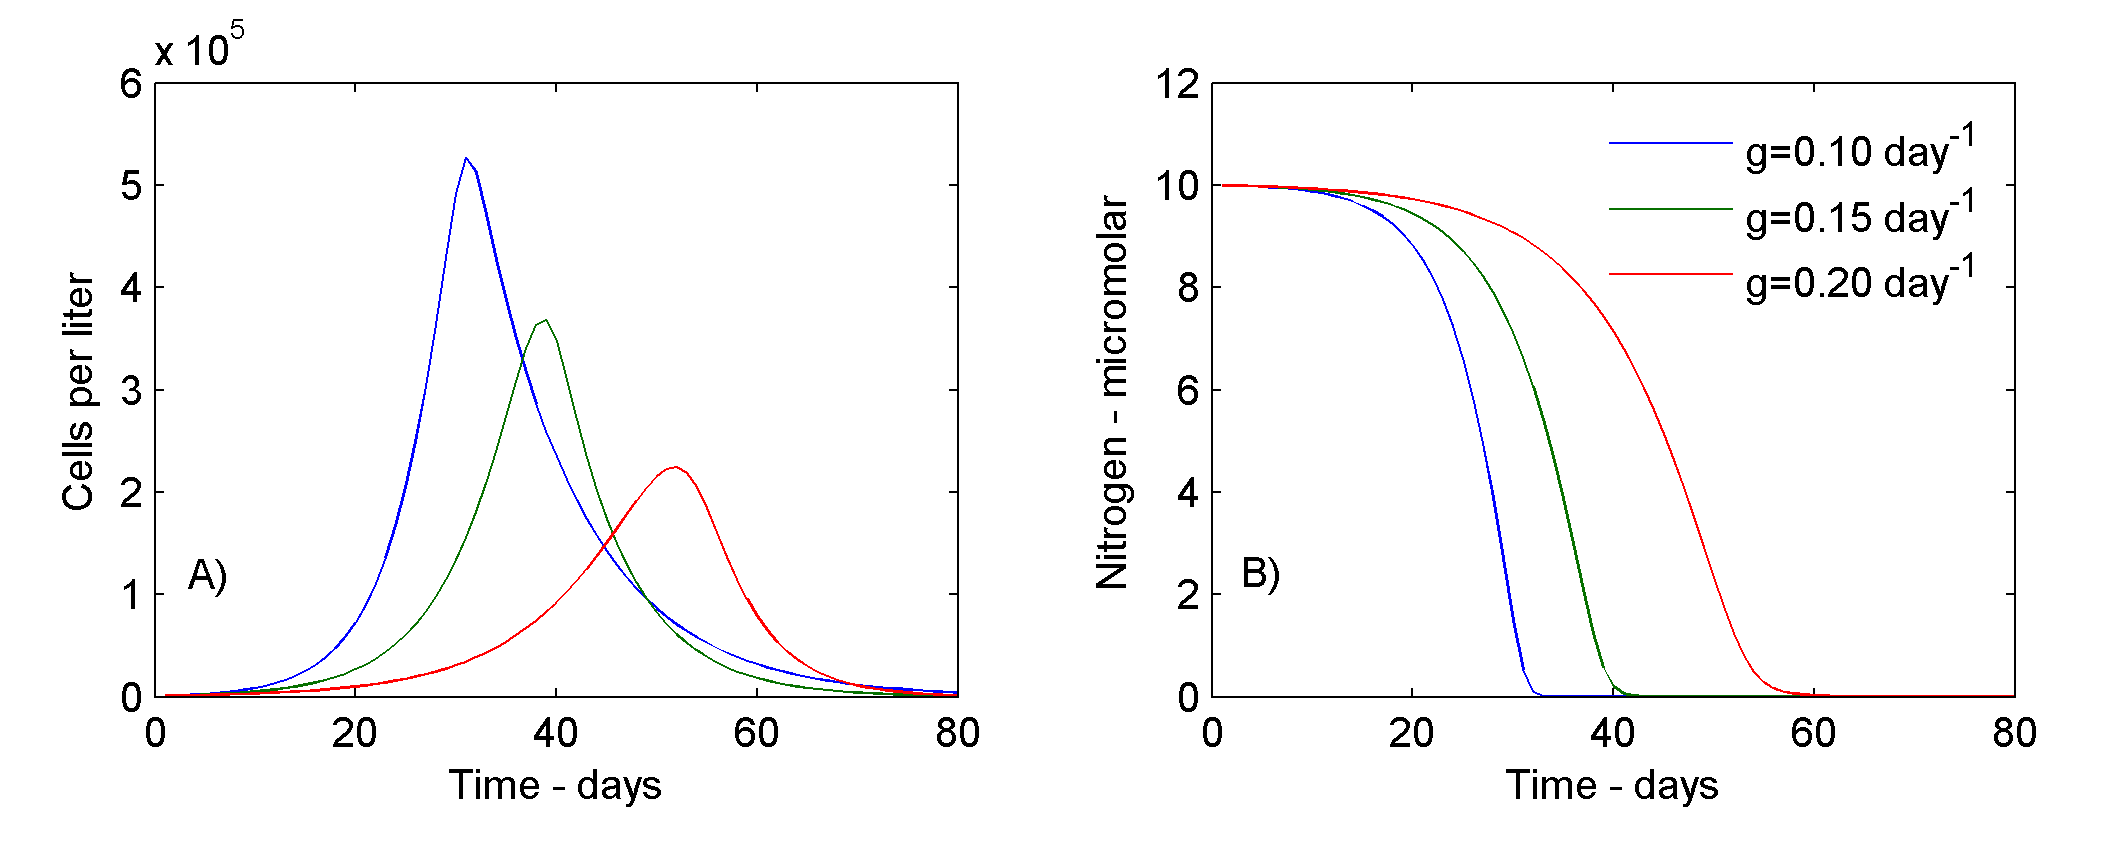
Figure 3. Phytoplankton (A) and Nitrogen (B) concentration under nutrient-limited phytoplankton growth and varied grazing rates.
If the specific grazing rate (g) is increased (see green and red curves in Fig 3) then the maximum concentration of cells is reduced and occurs later; doubling g, for example, causes the maximum cell concentration to be delayed by more than 20 days. In addition, depletion of N is delayed.
Inference: Phytoplankton blooms can take very different forms, in terms of both their magnitude and timing, depending on the presence and intensity of grazing. Note that in the ocean the grazing mortality rate, represented by parameter g, will not be constant, but will change as grazer populations respond - in their feeding rates, reproduction and recruitment - to changes in abundance of phytoplankton.
Another inference from the model is that temporal changes in phytoplankton abundance at a locality cannot be understood by considering only processes influencing phytoplankton specific growth rate (µ); patterns of grazing mortality (as well as other losses) must also be considered.
As an example of how to model grazing impacts on phytoplankton with nutrient limited growth, see the Matlab model here.
|


 ORCID profile