|
In January 2011 I ran a four hour workshop on using Matlab. Many of the materials I used were adapted from Andrew Pershing's material, "Introduction to Applied Scientific Computing & Visualization with MATLAB", which you can find here. This is by no means a comprehensive course, it is simply an introduction to Matlab from the perspective of an oceanographer who uses it often.
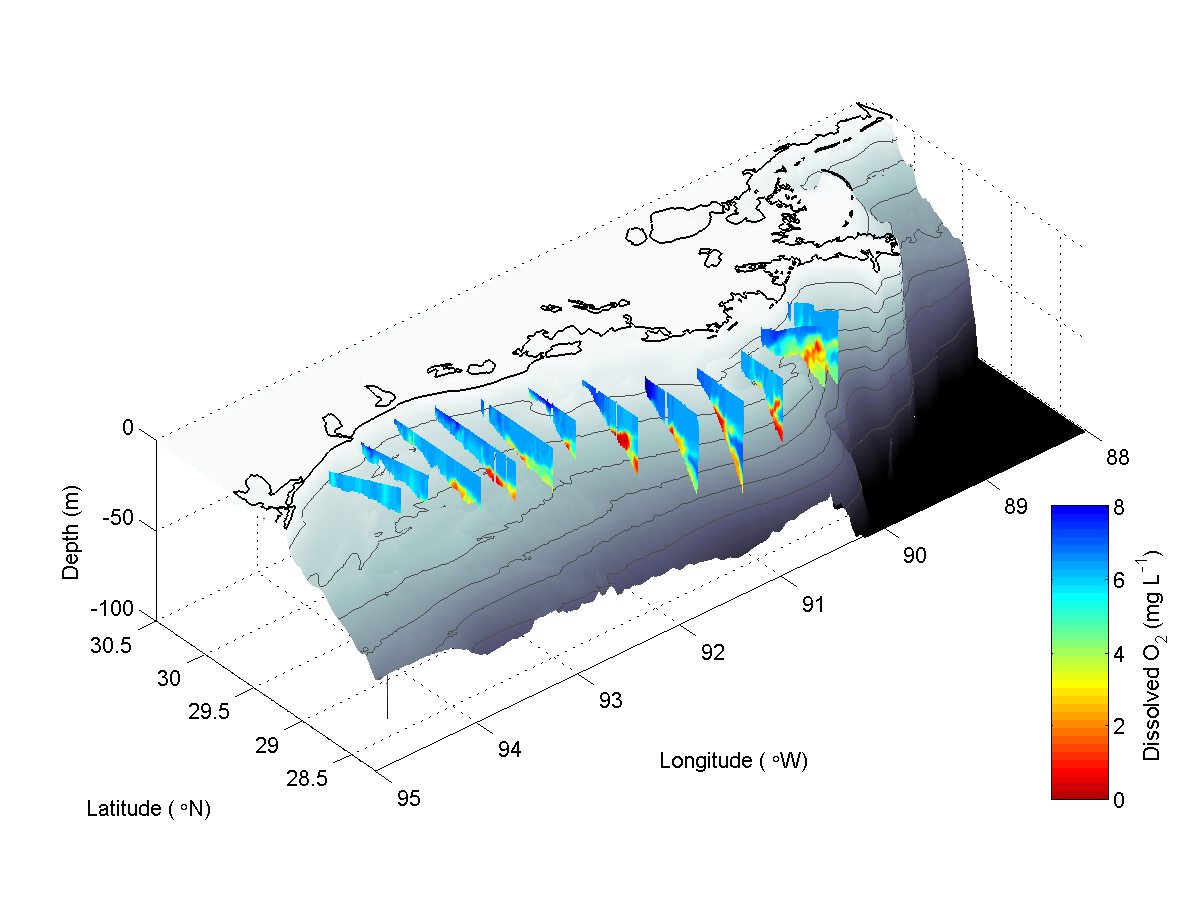
The workshop was broken up into five presentations of varying length and included one example of a complex plot (Fig. 1) with data provided by me. An html version of that example can be viewed here (created using Matlab's publish function) or by clicking the image, and you can download a zip file including the data and associated .m files to recreate the image here.
In addition, we created an .m file to convert .xyz files created with the NOAA GEODAS Grid Translator - Design-a-Grid service to download bathymetry and topography files called xyz2mat.m. Download the xyz2mat.m file here and view a published version of the script in html here.
The five presentations can be downloaded as a .zip file of .pdf presentations here, or individually below.
- Introduction (.pdf)
- Graphics (.pdf)
- Statistics (.pdf)
- Mapping using m_map (.pdf)
- Resources (.pdf)
Some recommended .m files available from the Matlab File Exchange are listed below with links to the File Exchange. This is by no means an exhaustive list, just some examples of files I've found useful to get you started searching the File Exchange:
In addition there are a set of utilities created by Peter John Acklam that can be accessed here. |


 ORCID profile